← Projects·Quantitative Researcher
Backtest Engine + Cost Model
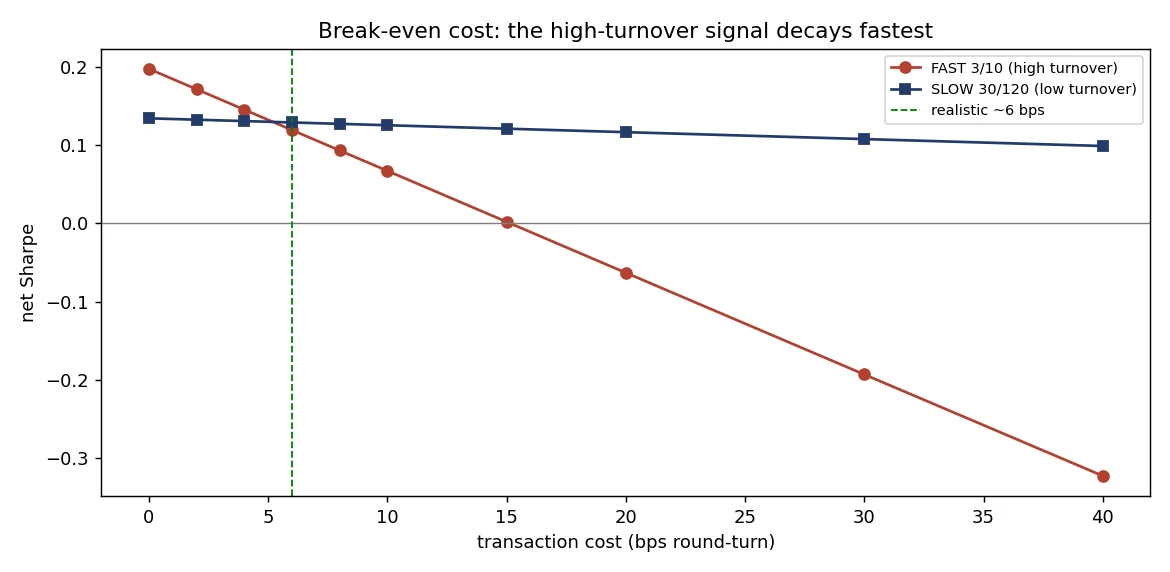
A backtest engine with a realistic cost model: spread + slippage + impact. The interesting result is a signal that *wins gross* and *loses net* : the cost model is the judge of whether a high-frequency idea is deployable.
0.20
Sharpe (gross)
< 0
Sharpe (net, realistic)
loses after cost
~20 bps / RT
Break-even cost
The hypothesis
If the backtest engine doesn’t model realistic costs, every high-frequency alpha is an illusion. The cost model is part of the strategy : not a footnote.
What the project does
- Tiny event-driven backtest loop on a high-turnover signal.
- Cost model: spread + slippage + linear-impact estimate.
- Scans break-even turnaround cost : the cost level at which Sharpe net → 0.
The result
- Gross Sharpe: 0.20.
- Realistic net Sharpe: < 0 : the signal loses after applying the cost model.
- Break-even cost: ~20 bps per round trip.
What’s transferable
A cost-model-aware backtest engine is the gate between a research idea and a deployable strategy. The discipline : ship the break-even turnaround, not just the Sharpe : is the senior reporting standard.